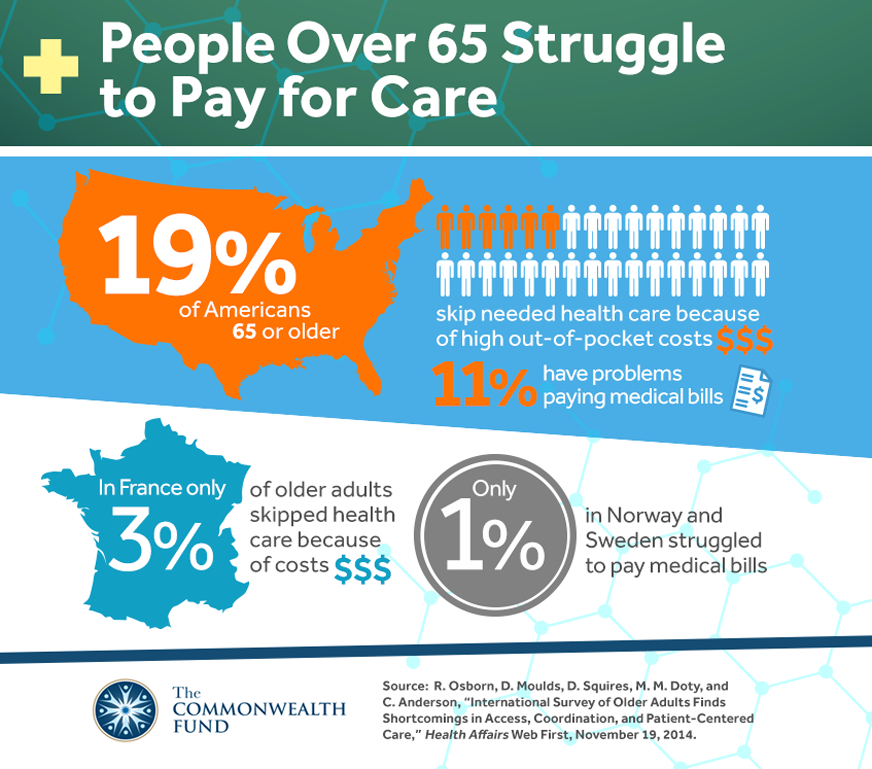
Despite Medicare coverage, 1 in 5 elderly Americans skipped care last year due to cost considerations. 11% struggle to pay medical bills. This is much higher than in other industrial countries.
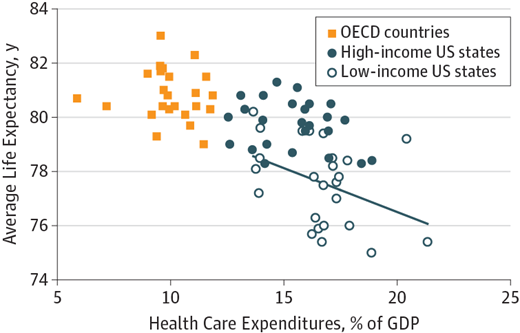
Notice that even the lowest income U.S. state spends more of its GDP on healthcare than any comparable country. Also notice that other countries are achieving longer life expectancies at much lower cost.
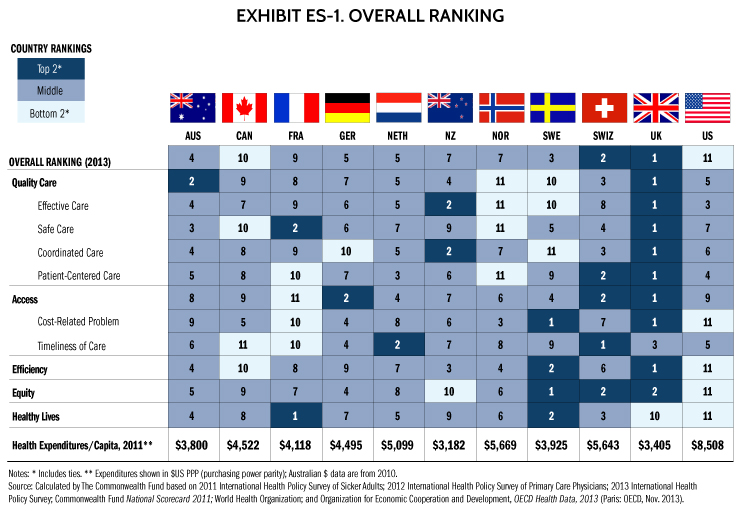
Compare relative costs and rankings.
Graph taken from the Commonwealth Fund
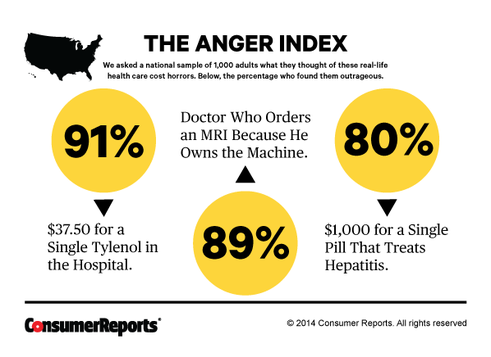
Costs to consumers continue to be outrageous and cause increasing anger among Americans.
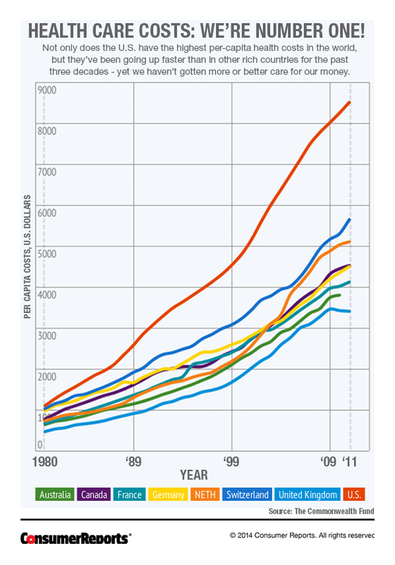
As a matter of fact, click on graph for a link to a new Commonwealth Fund study that ranks us last on many health quality measures.
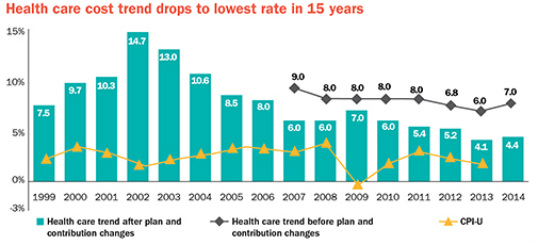
While health care costs are moderating (at least temporarily), it may not feel like it to the average American who is now personally paying more and more of the tab. (See Updates and Other News)
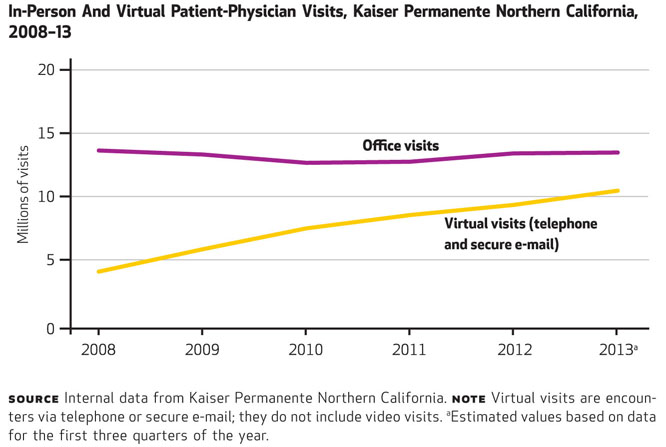
Patients hunger for greater access to their providers. Virtual visits are one patient centered method of connecting patients and their doctors.
From Health Affairs, Feb. 2014
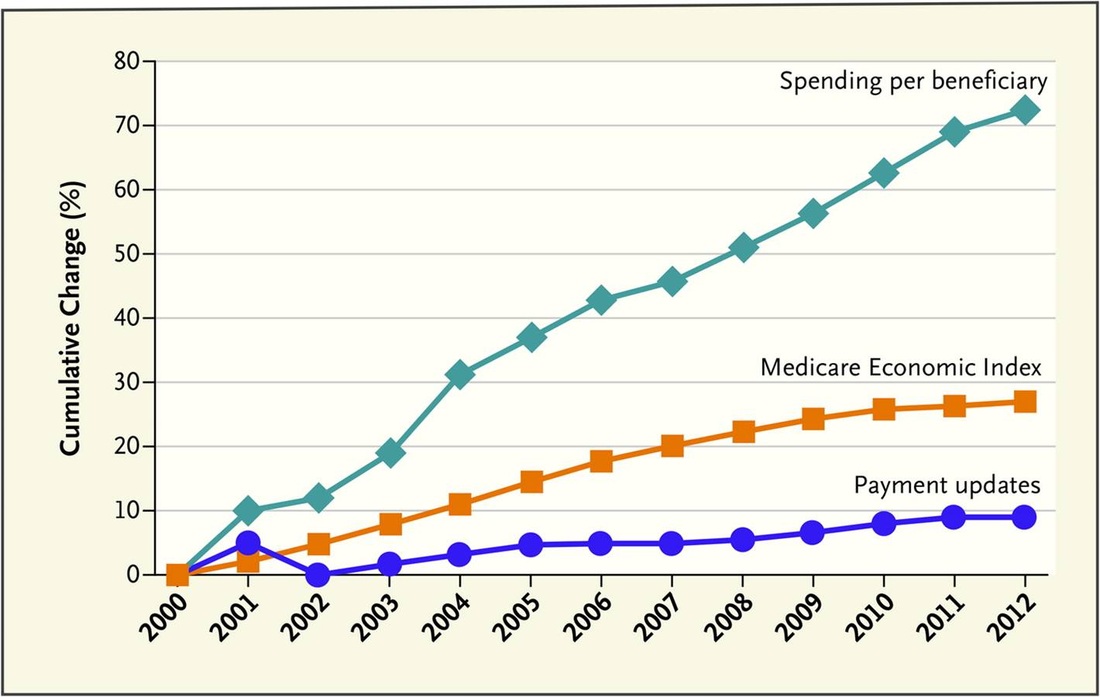
Increased Medicare spending is due to increased utilization per patient
Survey of nearly 300,000 Americans shows extent of medical care delayed due to cost constraints.
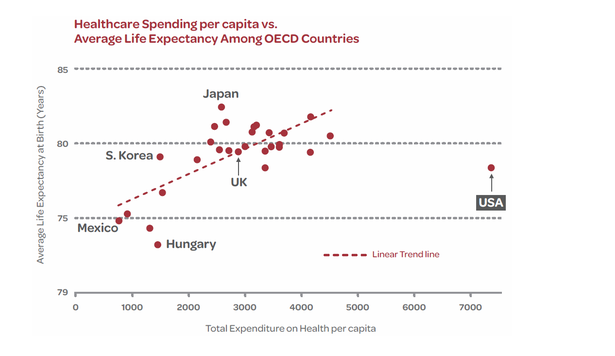
Graphically illustrating the cost/benefit problems with our healthcare system. Life expectancy on the y-axis, cost on the x-axis. Notice the position of the USA.
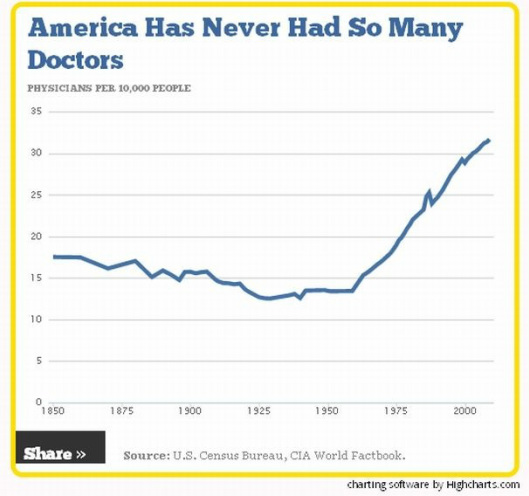
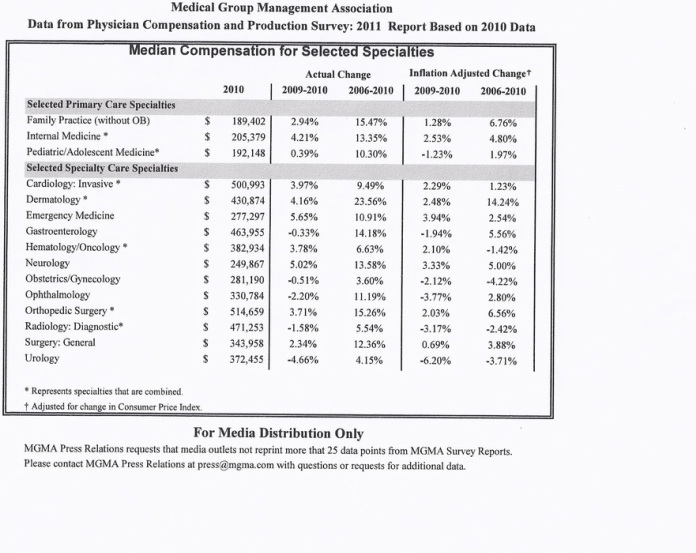
MANY DOCTORS BUT FAR TOO FEW PRACTICE PRIMARY CARE
Health Care Graphically
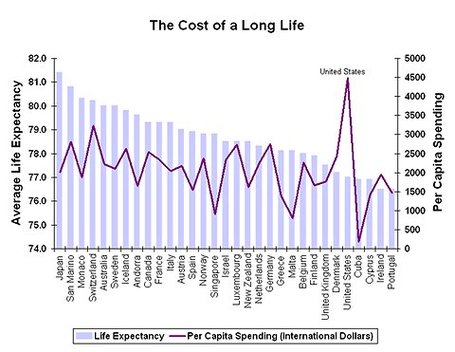
Taken from UC Santa Cruz's Atlas of Inequality, the US ranks just ahead of Cuba in life expectancy while spending vastly more than any other country. Only large-scale systemic reforms can improve this situation.
The Gap Continues to Widen between Specialists and Primary Care Docs
We won't fix our system this way.
Learn More by Clicking Here
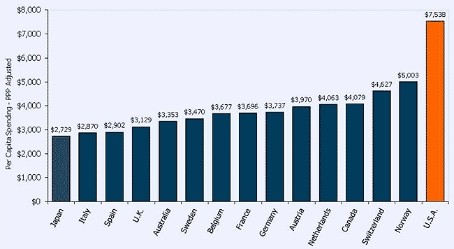
WHO'S THE OUTLIER HERE? ESPECIALLY WHEN VIEWED IN LIGHT OF MORTALITY STATISTICS ABOVE
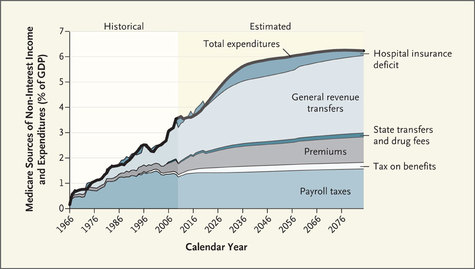
General revenue transfers (taxes) are rising faster than any other source of income for Medicare. They pay for physicians' services and drug expenses.
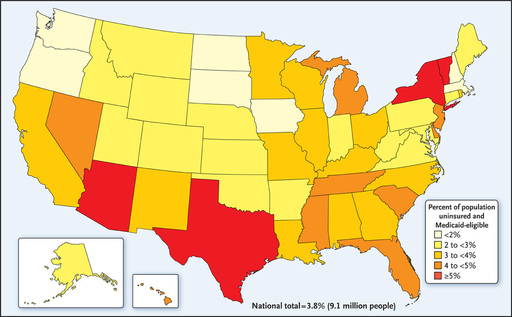
Texas has the highest percentage of Medicaid-eligible people not enrolled in the program.
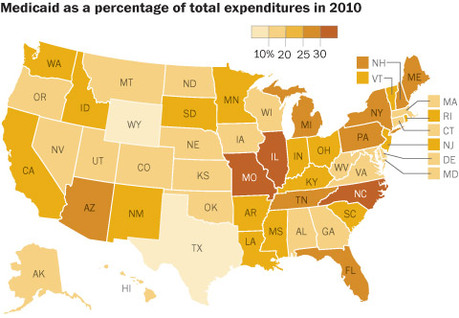
Taken from the Washington Post.
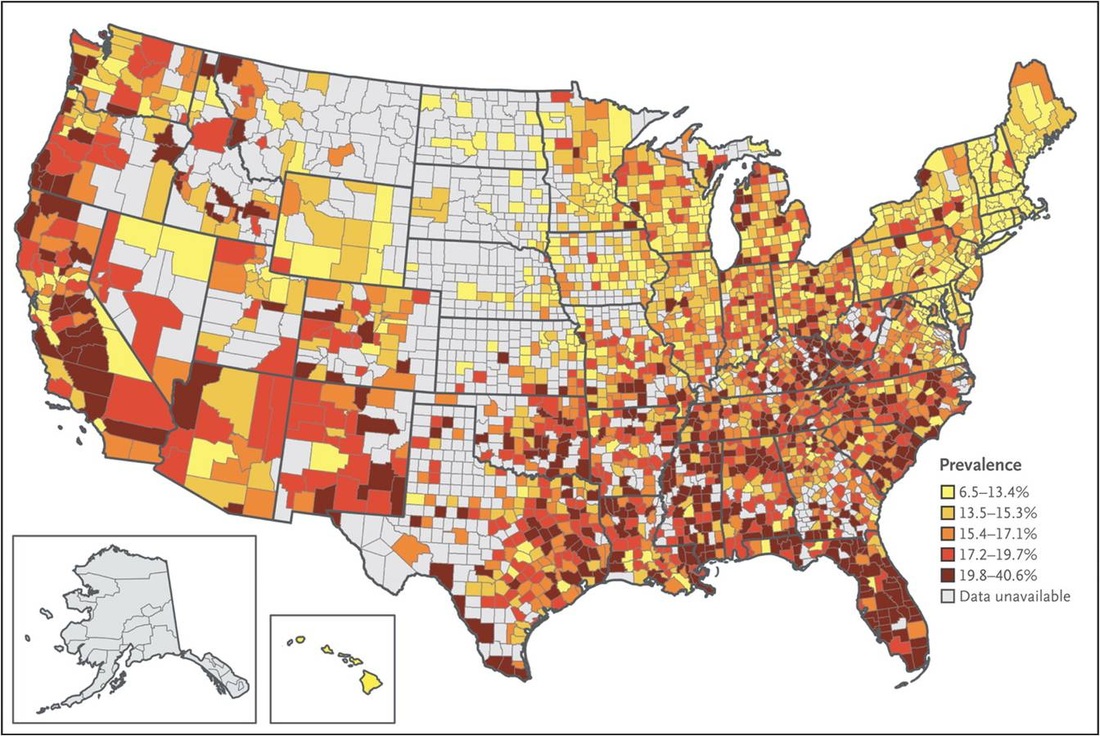
Medicare expenditure per beneficiary--2008
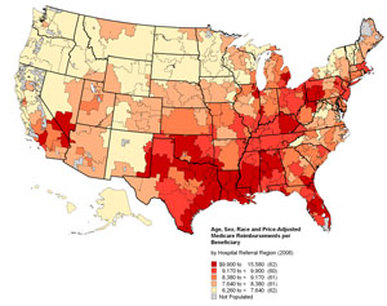
Medicare expenditures range from as low as $6200 in yellow areas to as high as $15,580 in dark red areas.
Taken from The New England Journal of Medicine.
Taken from The New England Journal of Medicine.
We are on the wrong side of the slope
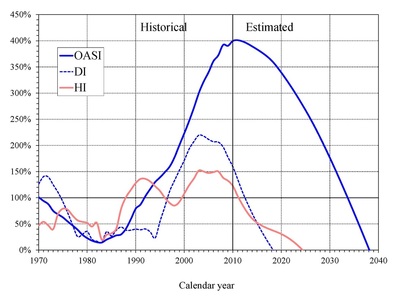
Follow the pink line. It represents Medicare's Hospital Insurance Trust Fund. Already it is paying out more than it brings in, and it will be exhausted in 2026.
See our page: Federal Realities for more details.
See our page: Federal Realities for more details.